Trade Area Troubles – Part 2
Recap
In my last blog, I wrote about using customer data, as depicted in the image below.
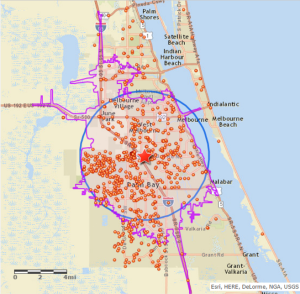
I Have a Confession
The “customer” data isn’t actually from a loyalty program, credit card data or a traditional customer intercept study. Rather, the points are actual visitors to the site. So what is it?
Mobile Device Location Data
The “customers” are actually frequent visitors to a retail location we were studying. We identified visitors to that retailer by using privacy-friendly, GPS-based mobile device location data using geo-fences.
Case Study
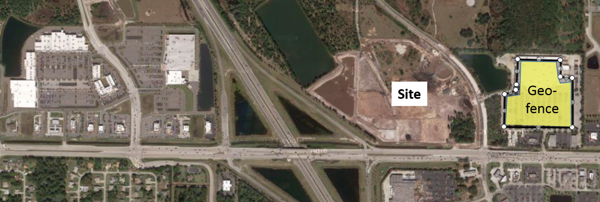
Our client was considering a site adjacent to an existing retailer. To better define the probable trade area, we studied the visitors of the adjacent retailer (geo-fence) through the use of the mobile data.
Step 1 was to geo-fence the neighboring retailer and dedicated parking. A geo-fence is simply a polygon based on latitude and longitude vertices.
Step 2 was to identify mobile devices that were observed within the geo-fence.
Step 3 was to determine the most likely residential locations for the identified devices.
Step 4 was to delineate the trade area using the trade area app we developed and use within Alteryx.
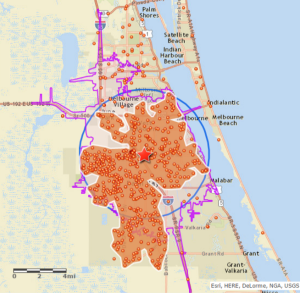
Case Study Results
The good news for this site is that the trade area was ripe with the client’s target Mosaic segments.
The bad news…understanding the retail patterns for this market (we also analyzed a shopping center across the interstate) demonstrated a greater likelihood for cannibalization than we first proposed.
In the end, the client decided not to move forward with the site due to the risk to the sister store.
Conclusions (this will sound like a sales pitch)
The ability to use the precision and volume of mobile device data to assess sites and build trade areas provides incredible insight. Some of the applications for this data include:
- Store trade areas (yours and your competition)
- Site/Mall/Shopping Center assessment via demographic and psychographic profiling
- Cannibalization studies
- Real Estate Strategy Development
- Mergers & Acquisitions
The beauty of this approach is that:
- You are intercepting the customers, but not interrupting them.
- Your sample size is typically in the thousands
- You can differentiate between individual stores
- You can slice the data by day and hour (daypart)
Considerations
I know you probably want more technical information on this process – here it is.
Mobile Data Source
For the record, our data partner is UberRetail. My contact there is Doug Shaddle, Director of Sales and his phone number is 619-405-3684 and his email is [email protected].
Validity
B. I. Spatial compared the use of the mobile device data to the use of other loyalty program data. The results were incredible. In fact, because of the comparison, some of our clients no longer match their loyalty data only to addresses. The name and address-based trade areas were incredibly similar to the trade areas using the mobile device data.
In discussions with our clients we came to the conclusion that address matching didn’t account for new addresses (people moving). So, even if the customer was truthful about his/her address when joining the loyalty program, the address was probably never updated. According to the Census, about 14% of people move every year. It doesn’t take long for this data to become inaccurate. This is not an issue with the mobile data.
Accuracy
We define very accurate Geo-fences. As you saw in the image above, we do not simply use a radius. We restrict the geo-fences to the actual building and dedicated parking to the location we are analyzing.
GPS precision is the key as it is 50x more accurate than the cell tower triangulated data (within 20 feet vs. 1,000 feet). The precision allows us to distinguish an individual store’s visitors.
Frequency
Mobile devices must have been observed multiple distinct days to be considered. As with all data, there can be occasional hiccups. Incorporating frequency helps determine a pattern of behavior, thereby yielding a greater confidence in the data.
Observations
B.I. Spatial reports the number of observations incorporated into the trade area analysis so that the end-user may assess the validity of the analysis.
Likely Home Location
B.I. Spatial’s proprietary algorithms scrub the data, including dozens of spatial filters, with the goal of achieving the most likely residential location. On average, our process analyzes more than 1,200 locations before a home location is finally determined.
ICSC Research Connections: October 18th – 20th
UberRetail and B. I. Spatial will both be at the conference next week. Doug will be at the UberRetail booth while Patrick O’Neill and I will be helping out at the Alteryx booth. If you are there, please stop by and say hello. Patrick can be reached at 360-369-6306 and his email is [email protected]. My phone is 336-209-4321 and my email address is [email protected].
Thanks again for taking the time to read this.